The final goal of this project is to create a dynamic, database-driven web page using a combination of all of the technologies that are covered in this course.
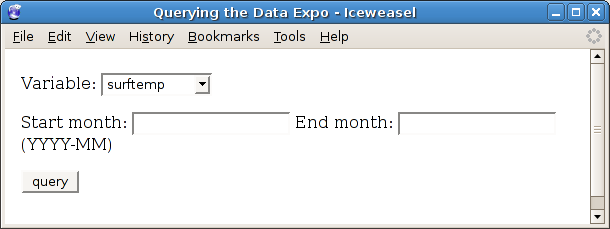
The basic web page is very simple; just a few form elements
to allow a variable to be selected and a range of dates, plus
a button to perform a database query based on the inputs.
It looks like this:
The menu provides a list of seven variables to select from: surftemp, temperature, ozone, pressure, cloudlow. cloudmid, and cloudhigh.
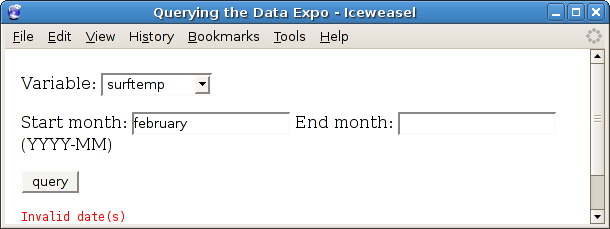
The date fields must either be completely blank or conform to the
pattern YYYY-MM. Anything else results in an error message when
the 'query' button is clicked:
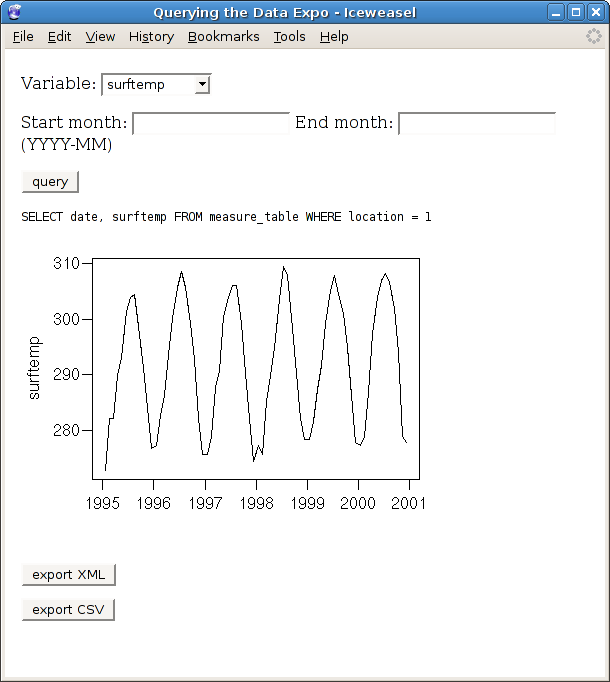
When the 'query' button is pressed (with valid form inputs),
a query is sent to a database and the results are plotted.
The query is printed above the plot and two more buttons are
added below the plot:
The database that is queried contains monthly atmospheric measurements for seven variables at 24x24 geographic locations. The tables in the database have the following structure:
date_table (date [PK], month, year)

location_table (ID [PK],
                longitude, latitude, elevation)

measure_table (location [PK] [FK location_table.ID],
               date     [PK] [FK date_table.date],
               cloudhigh, cloudmid, cloudlow,
               ozone, pressure, surftemp,
               temperature)
The database itself is available as an SQLite file.
Clicking on the 'export XML' button creates an XML document containing the result, called dataexpo.xml, and clicking on 'export CSV' creates a CSV file called dataexpo.csv.
This project will contribute 30% towards your final mark for the course.
The project is due at 9:00am (Austrian time) Friday December 7.
Submit your project by emailing it to me.