The object 'Nile' contains values representing measurements of the annual flow of the river Nile.
Time Series:
Start = 1871
End = 1970
Frequency = 1
  [1] 1120 1160  963 1210 1160 1160  813 1230 1370 1140  995  935 1110  994 1020
 [16]  960 1180  799  958 1140 1100 1210 1150 1250 1260 1220 1030 1100  774  840
 [31]  874  694  940  833  701  916  692 1020 1050  969  831  726  456  824  702
 [46] 1120 1100  832  764  821  768  845  864  862  698  845  744  796 1040  759
 [61]  781  865  845  944  984  897  822 1010  771  676  649  846  812  742  801
 [76] 1040  860  874  848  890  744  749  838 1050  918  986  797  923  975  815
 [91] 1020  906  901 1170  912  746  919  718  714  740
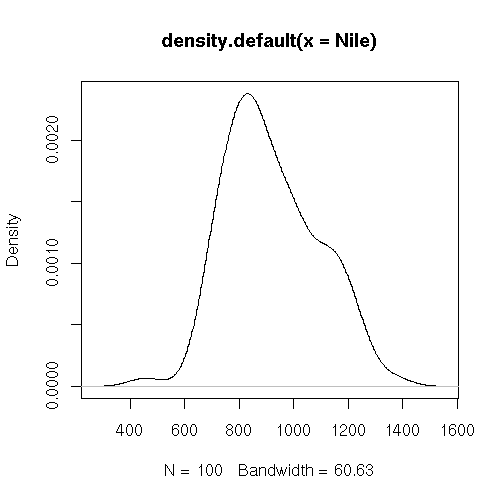
A summary of the flow values suggests that they are right-skew (the mean is larger than the median).
|
A histogram of the values supports this view.
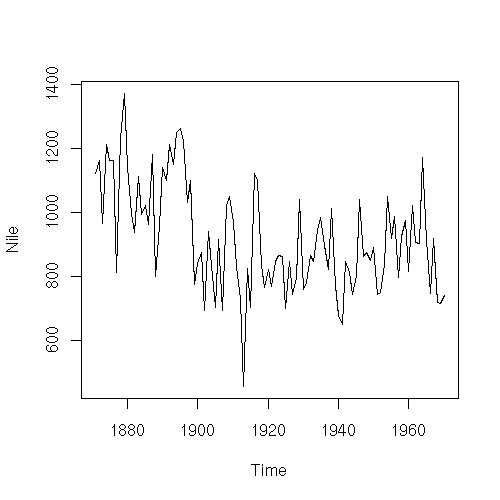
However, as these values are a time series, we should check whether the skew is related to a time effect. A time-series plot of the values shows that this is the case (there is a quantum shift in the values around 1900).